Projects
The Data Lab supports World Bank operations – lending, technical assistance, and economic reporting – by coordinating ad-hoc teams of data analysts and specialists from across our organization. Through the Lab, teams solve global challenges using best practices in coding, code documentation, and data visualization.
Unlike a traditional data analysis, which results in a single-use report or visualization, Data Lab products are designed to be customized, reused, and updated, thereby building the capacity of the World Bank and partner organizations to quickly deliver complex data science solutions to pressing global challenges.
For more information about how we work, check out the intro page to this sample project, or search our portfolio, below. Got questions? Click the "Ask The Lab Anything" button on our Data Lab Site.
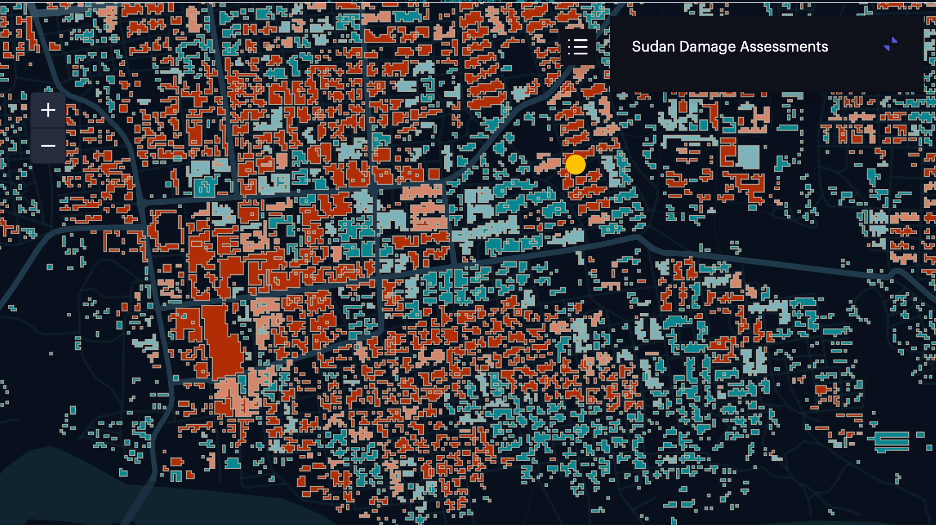
Sudan | Poverty Monitoring
We worked with the East Africa Poverty team to monitor poverty and economic trends in crisis-torn Sudan and South Sudan, using alternative data to analyze crop productivity, conflict, building damages, flooding, internet connectivity trends, nighttime lights trends, and urban expansion.
View More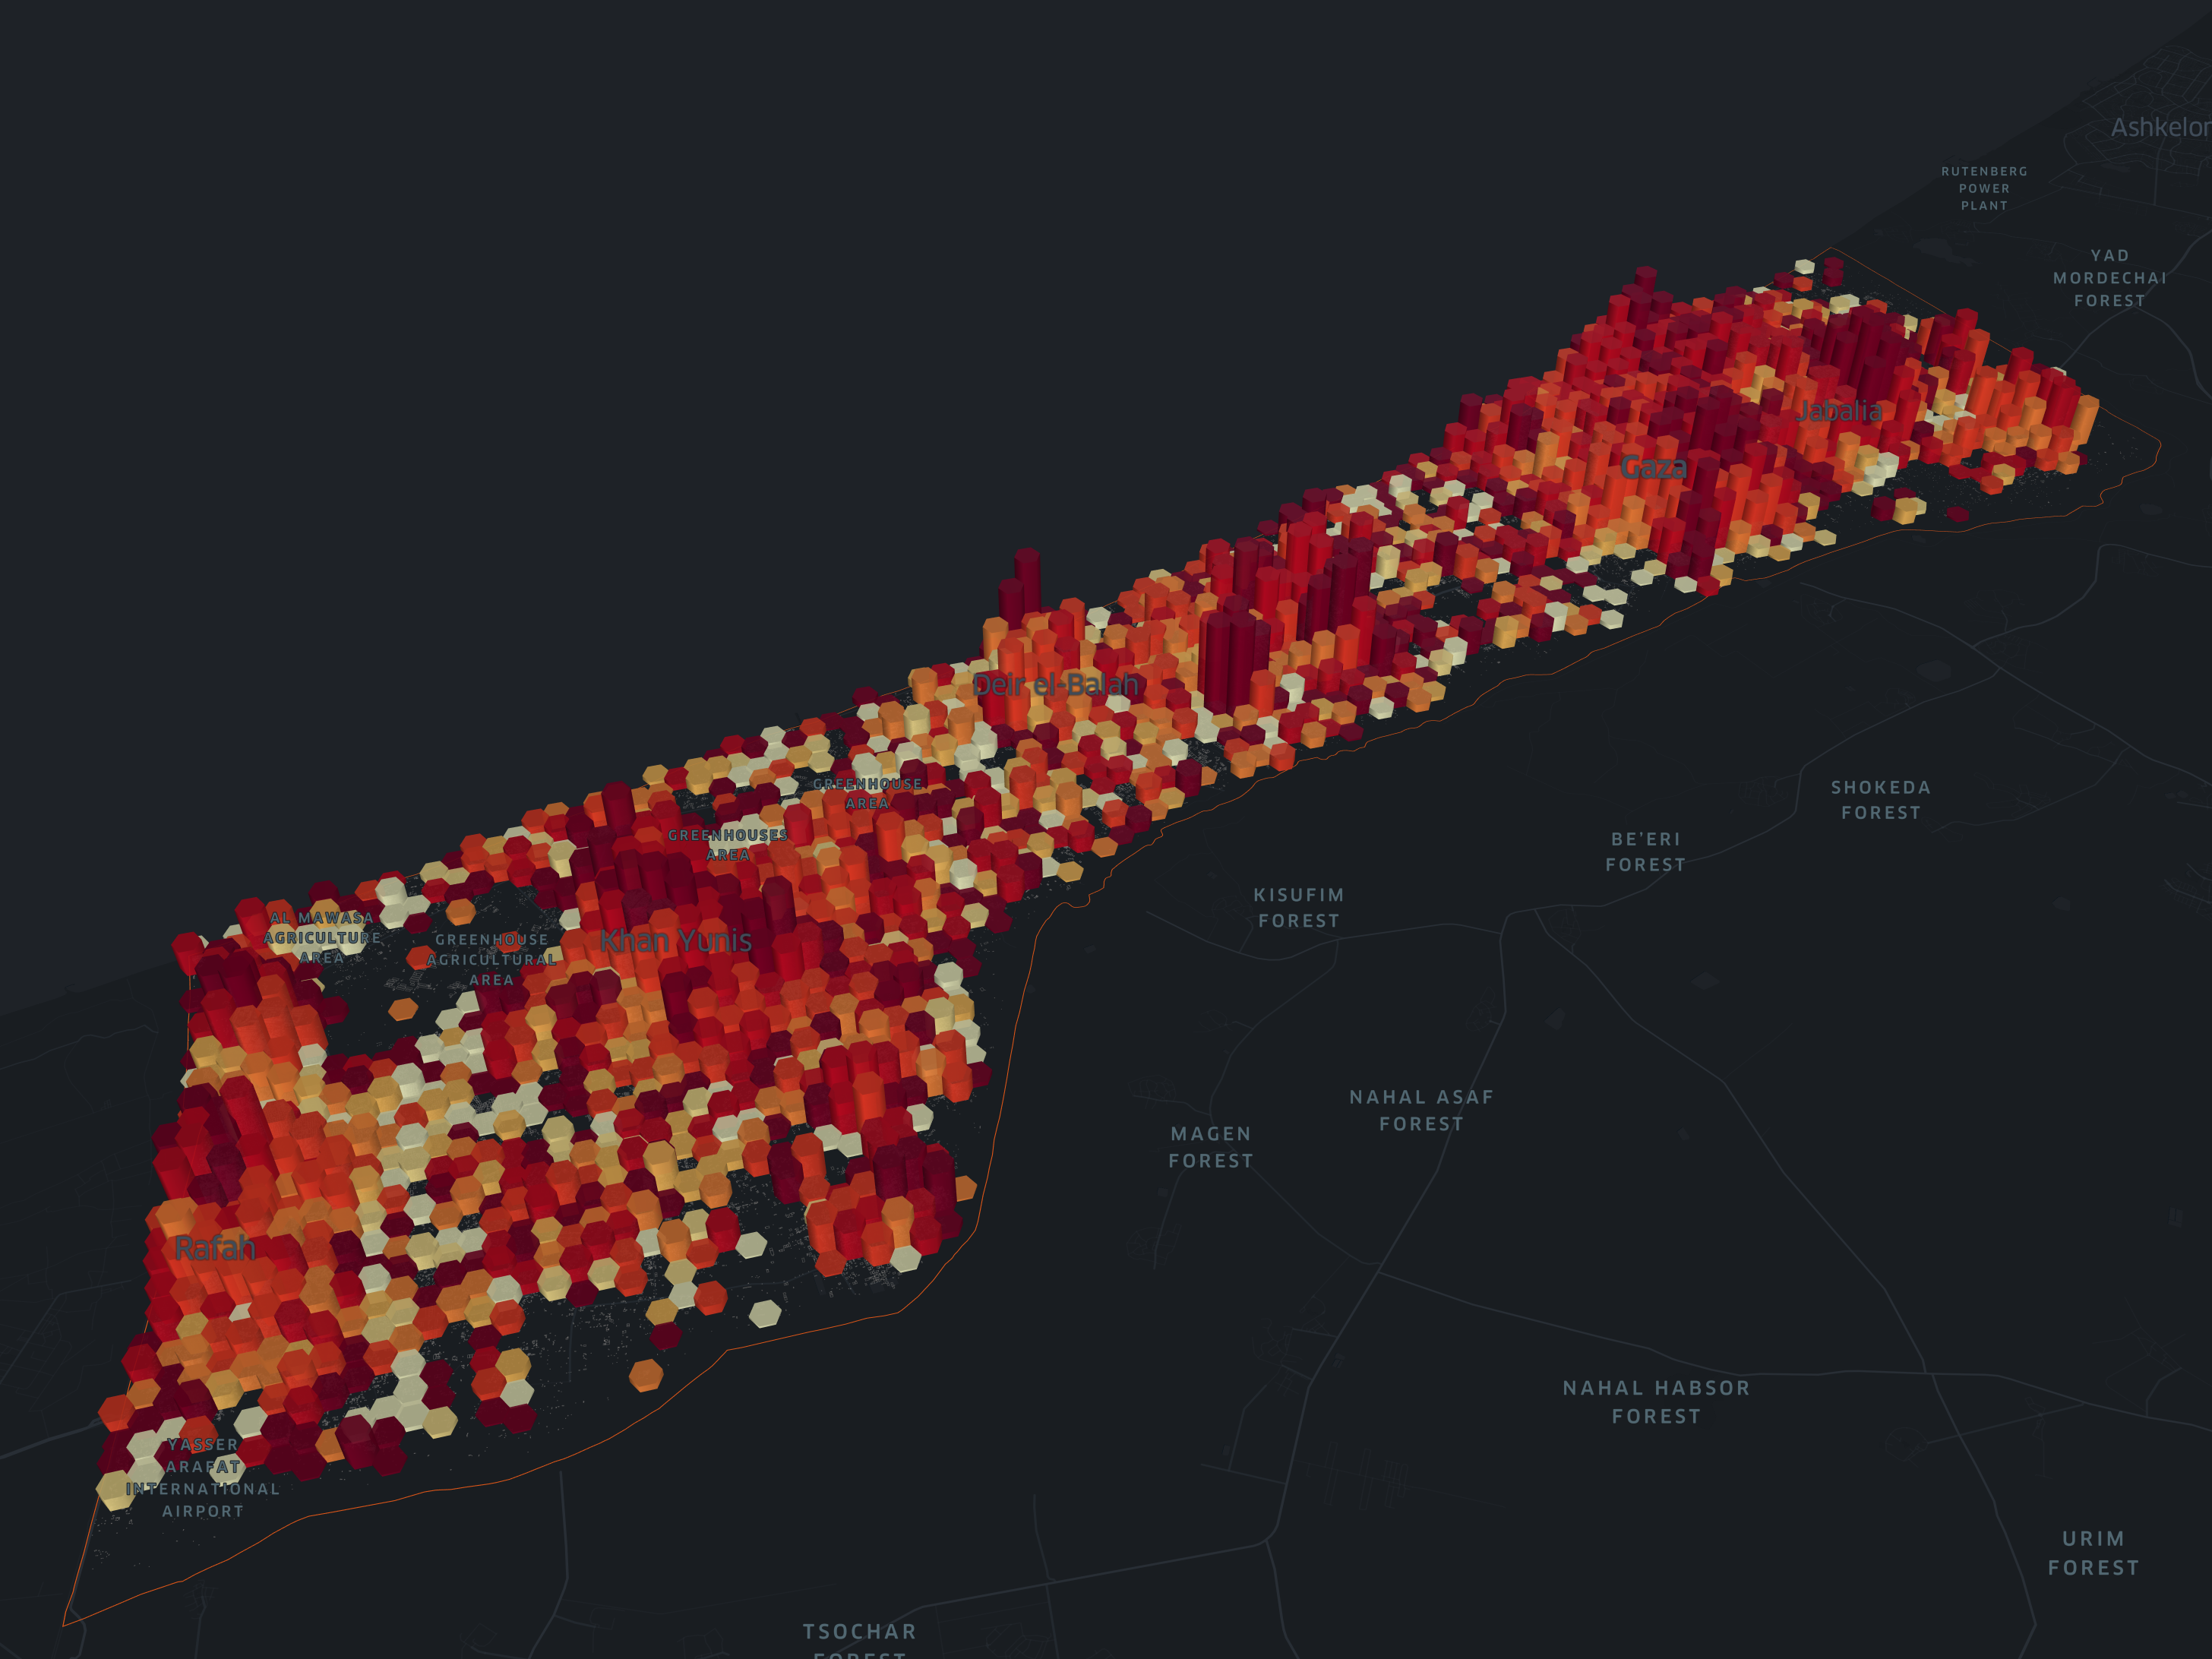
Gaza | Conflict Impact Analysis
The 2023-25 Gaza-Israel conflict has had profound economic implications that extend beyond conventional measures. This project explored alternative data sources, such as synthetic-aperture radar and Mapbox Movement, to better comprehend the multifaceted economic impacts on the Gaza Strip.
View More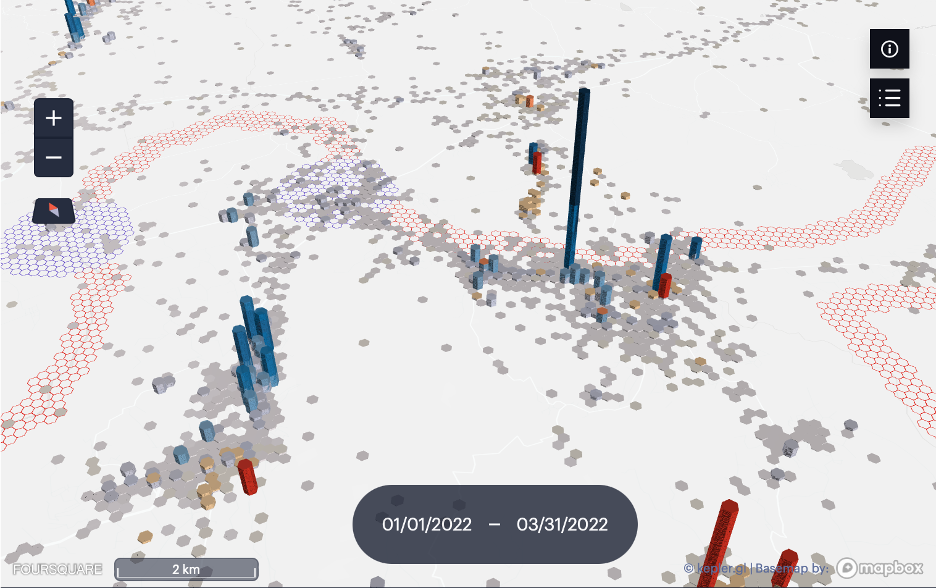
Syria | Economic & Earthquake Monitoring
The conflict in Syria has inflicted a devastating impact on the inhabitants and economy, but measuring the true extent of the damage has been challenging.The Syria Economic Monitor team requested the WB Data Lab to explore use of alternative data to better understand changing trends in trade and economic activity, focusing on: port activity, surface cross-border transport routes, changes in observed agricultural production, observed nighttime lights, and reported conflict.
View More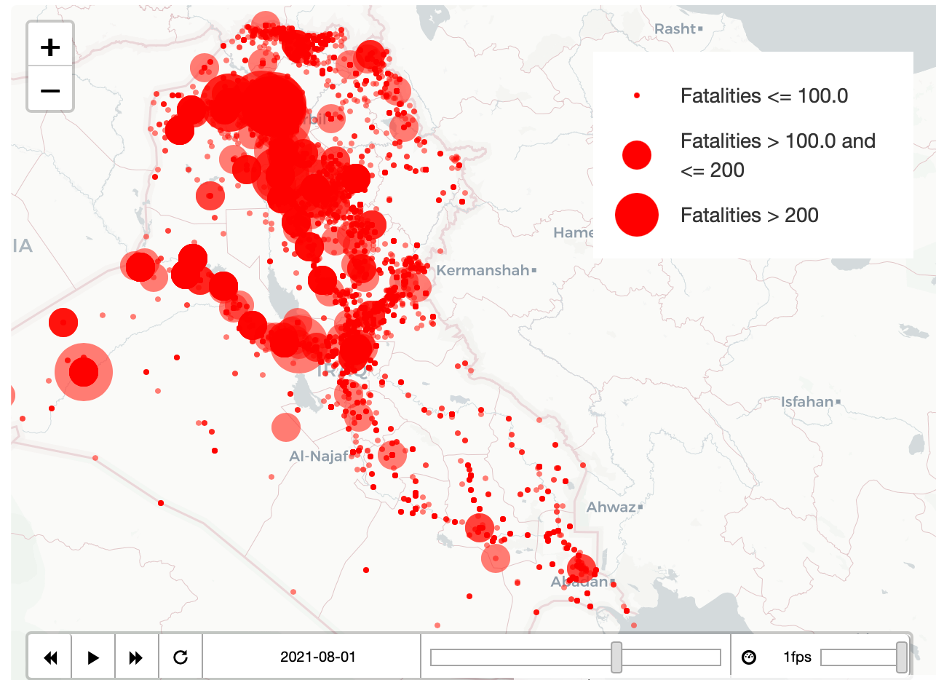
Iraq | Economic Monitoring
We supported the Iraq country economics team in using alternative data to analze trends in conflict, nighttime lights, maritime traffic, and construction activity.
View More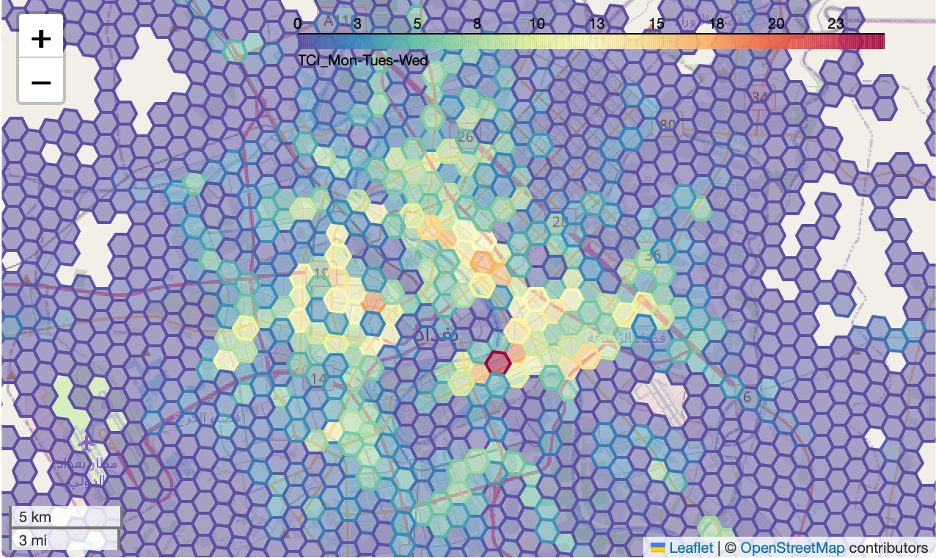
Iraq | Baghdad Transport Planning
For the MENA transport team, we used Waze and remote sensing data to monitor traffic trends.
View More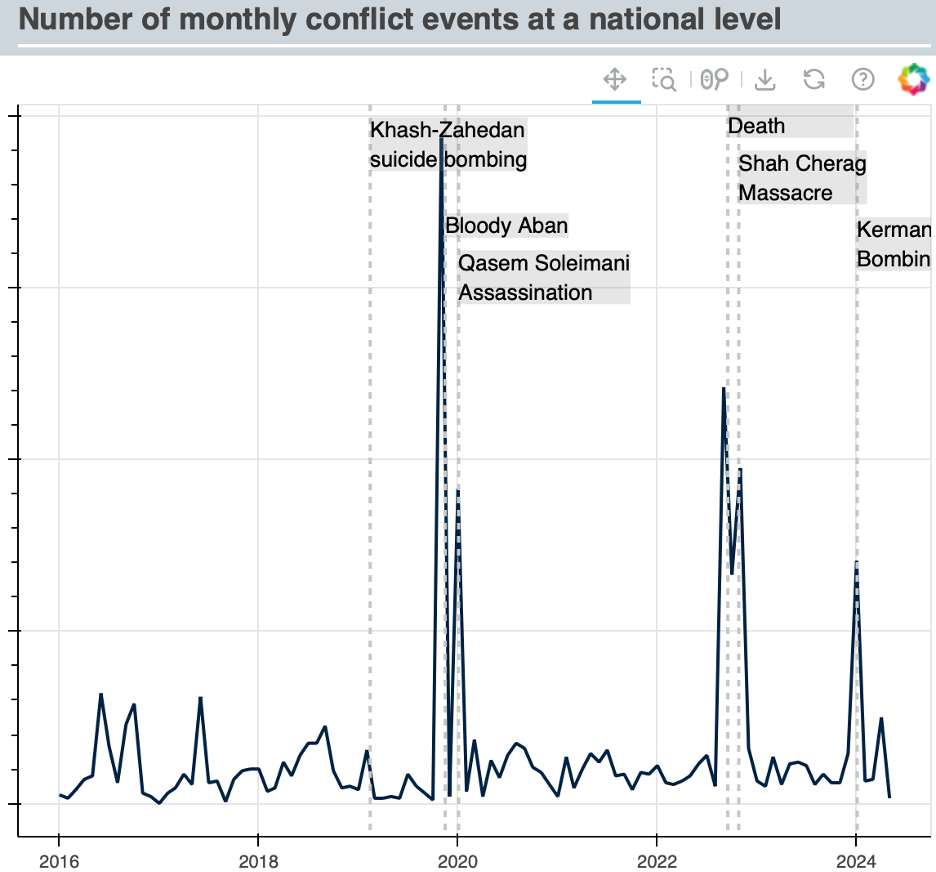
Iran | Economic Monitoring
Working with the Iran country economics team, we used alternative data to help monitor key economic trends.
View More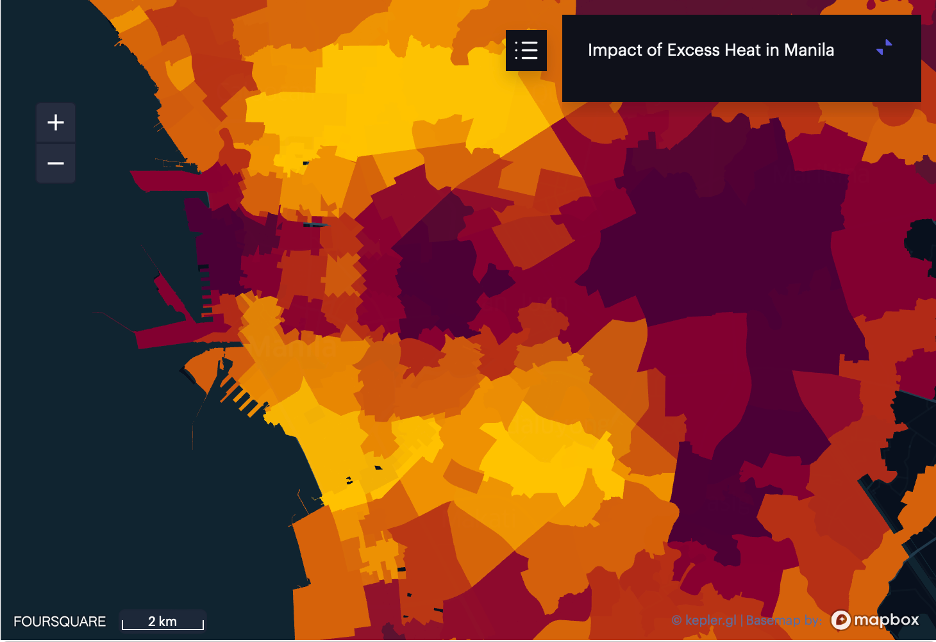
Philippines | Understanding Impacts of Excess Heat in Filipino Cities
The project empowers urban Philippines Local Government Units to take preventative and real-time action to mitigate the impacts of heatwaves through provision of more timely and granular data products.
View More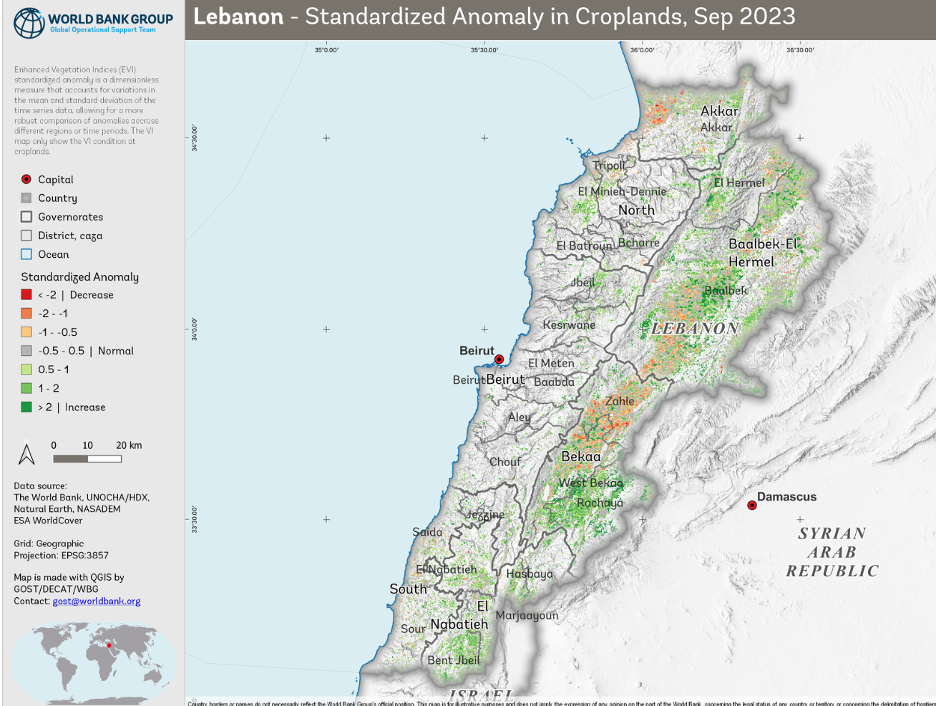
Lebanon | Economic Monitoring
Significant data constraints are a major concern for the Lebanon country economics team. The team used lternative data to support analysis of the Lebanon economic growth, conflict, demographics, and refugee dynamics.
View More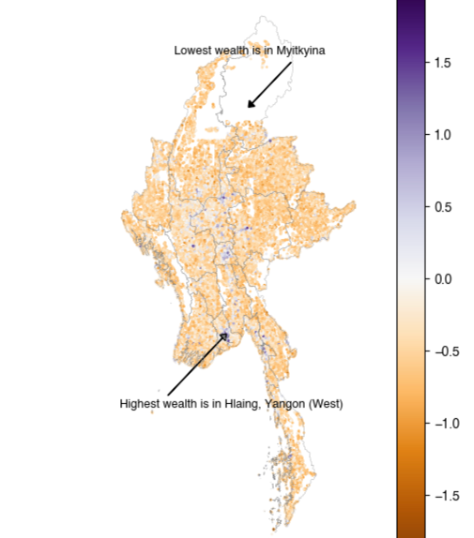
Myanmar | Economic Monitoring
Facing Covid, coups, and conflict, the Myanmar country economics team is challenged to fuifill its macroeconomic monitoring responsibilities.The Lab experimented with alternative data to understand changing trends in conflict, crop production, nighttime lights, and population movement.
View More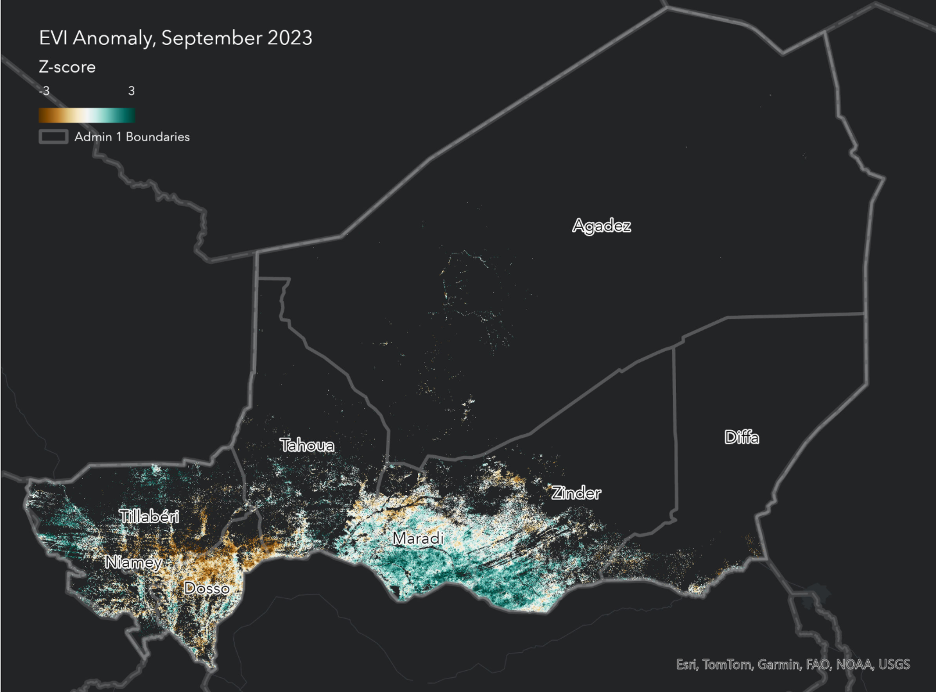
Niger | Economic Monitoring
The West Africa Prosperity Team requested support for using alternative data to better understand economic trends in Niger following a coup and civil unrest. We analyzed crop productivity trends, mapped conflict, monitored nighttime lights, and explored population movement trends.
View More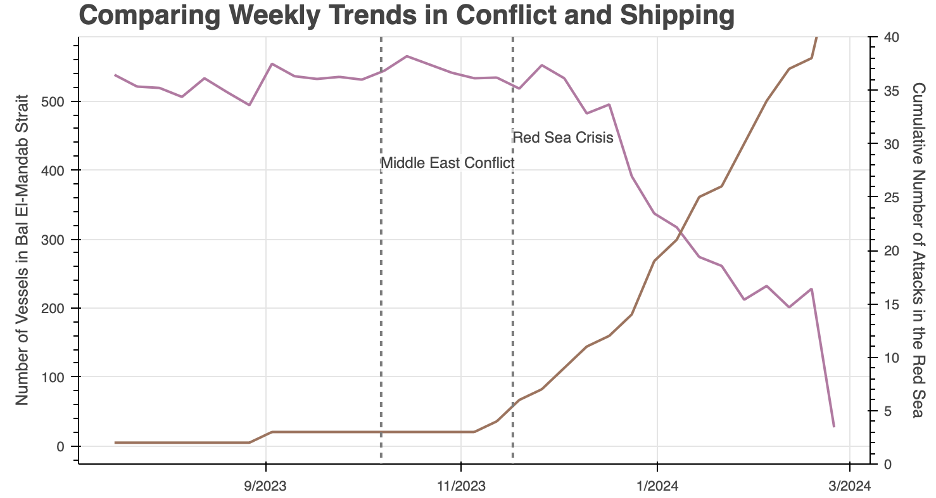
Red Sea | Monitoring the Red Sea Shipping Crisis
The Red Sea shipping crisis is a global crisis that began in October 2023, when missile attacks on ships and tankers traversing the Red Sea caused hundreds of vessels to avoid the Suez Canal. We helped the MENA MTI team understand the impact of these attacks in shipping, trade, tourism, and emissions trends.
View More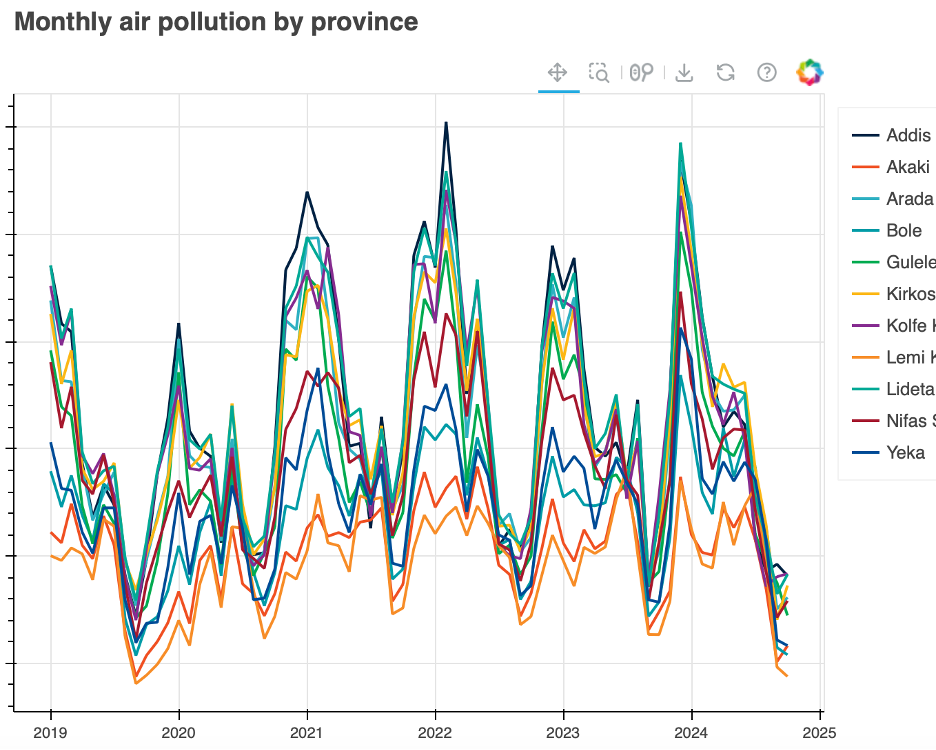
Ethiopia | Economic Monitoring
The East Africa Poverty Team requested support for using alternative data to better understand economic and poverty trends in Ethiopia. We ana;yzed urban air quality trends, crop production, and sentiment towards recent socio-poltical crises through crowd-sourced survey data and Google search trends.
View More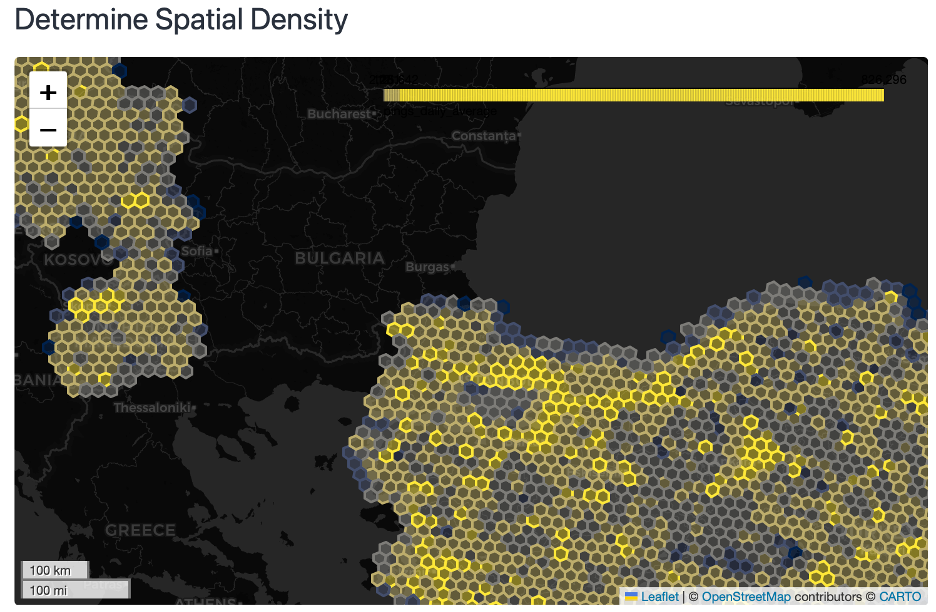
ECA | Urban Pulse Index
Understanding how populations use urban space is crucial for assessing economic activity, societal resilience, and infrastructure accessibility. We are exploring how human mobility and urban space usage change in response to climate shocks, using mobile device data.
View More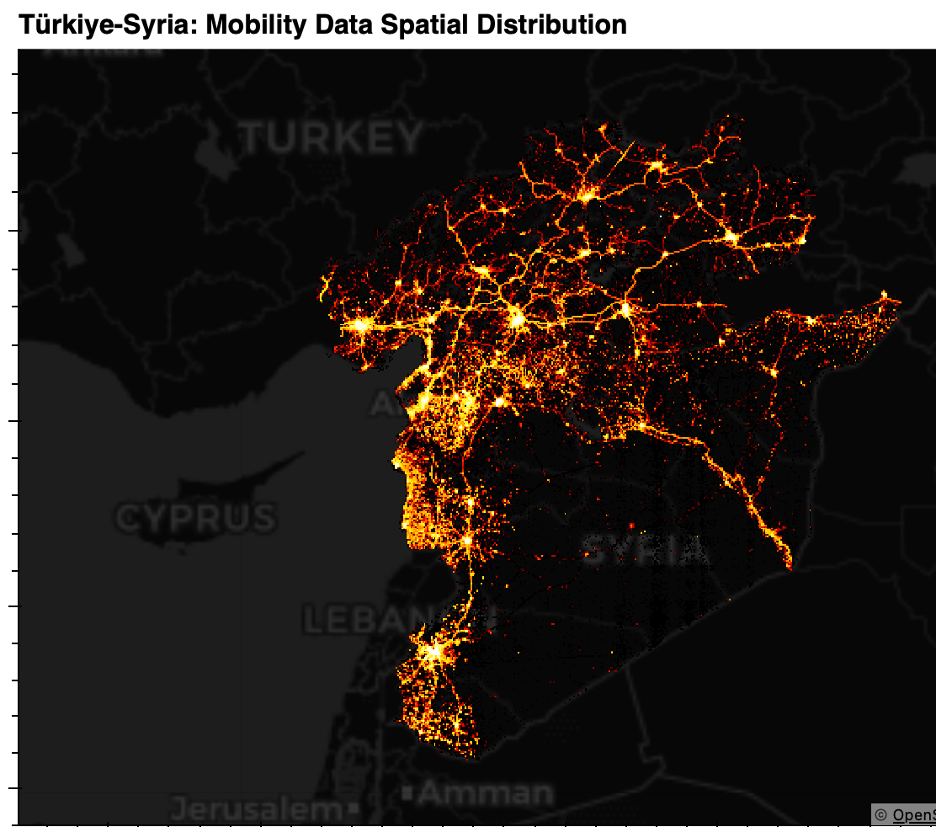
Turkiye | Earthquake Impact Analysis
On February 6, 2023, a powerful 7.8 magnitude earthquake and series aftershocks wrought substantial damages across southeastern Turkiye and northwest Syria. The Turkiye Country Economist team requested advisory on data and analytical resources that may support measurement and monitoring of socio-economic impacts, including population displacement and business impacts.
View More
Morocco | Earthquake Impact Analysis
In September 2023, a powerful 6.8 magnitude earthquake and a series of strong tremors and aftershocks wrought substantial damages in central Morocco. The Morocco Country Economist and Poverty Team requested advisory on data and analytical resources that may support measurement and monitoring of socio-economic impacts, including population displacement and business impacts.
View More
Python Package | Waze Data Analytics
We created a python package to make raw Waze mobility data receivied through the Development Data Partnership easier to use in traffic analytics.
View More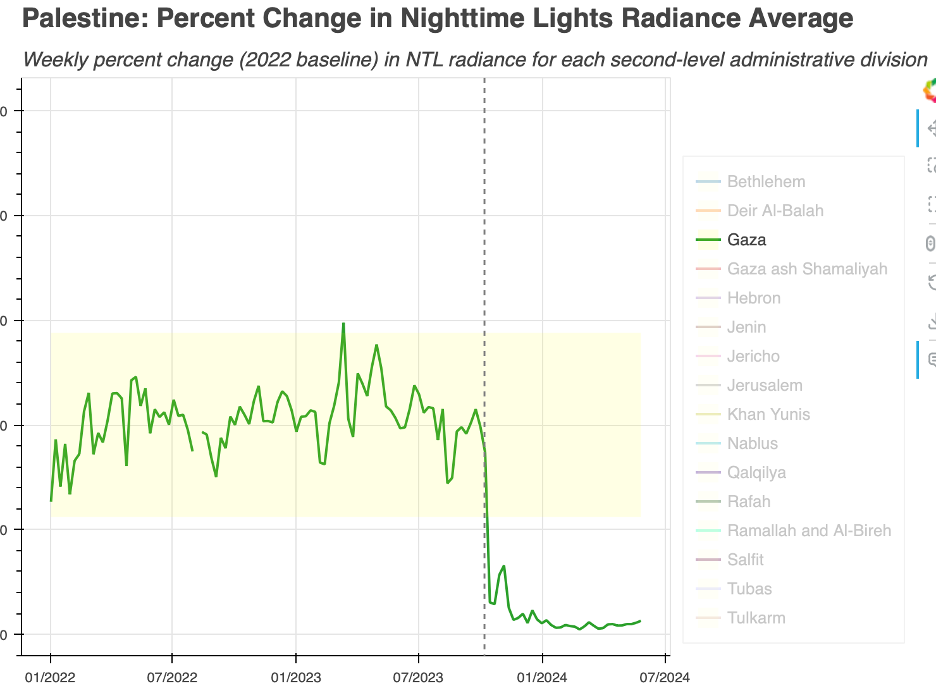
Python Package | Nighttime Lights
We built a Python packages for transforming NASA Black Marble nightimelights data into maps and charts in a snap.
View More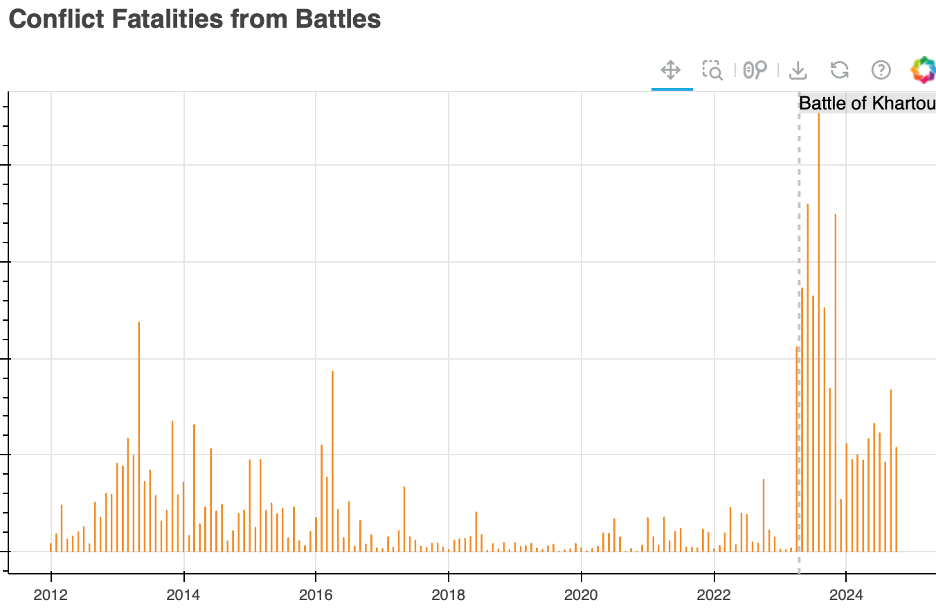
Python Package | ACLED
Conflict analytics are one of our most highly requested anlytics. To expedite this work, we created a Python package for analyzing ACLED data.
View More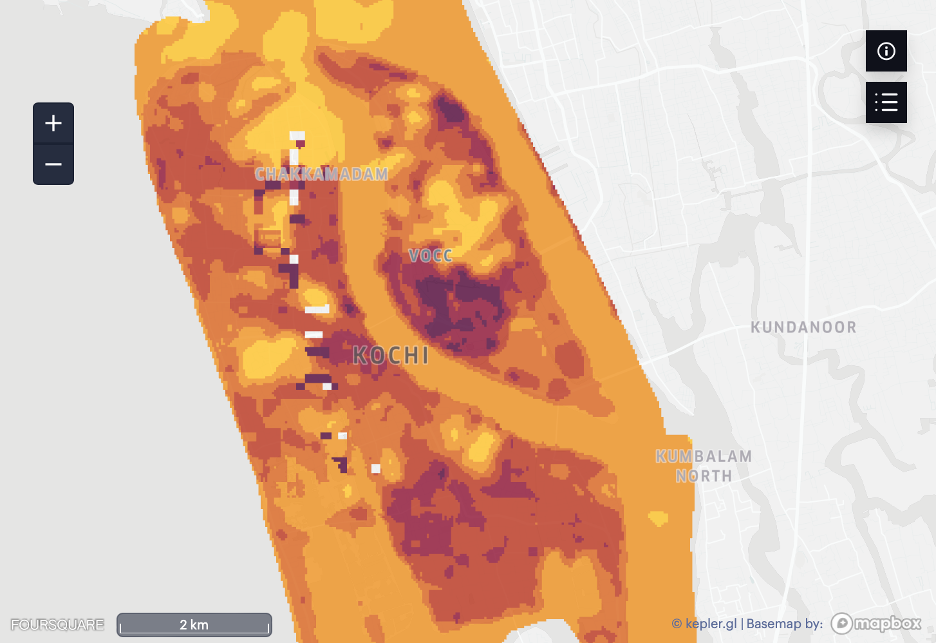
India | Resilient Kerala
Using open data, we studied the impact of heatwaves and air quality in Kerala, specifically in Kochi (also known as Cochin) and Trivandrum for a Development Economics Data Group project.
View More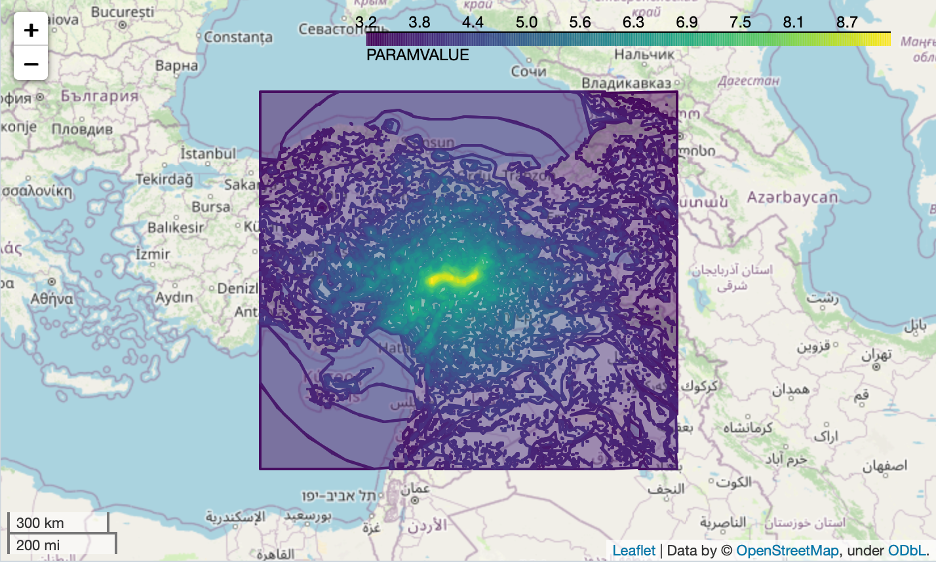
Course | Using Alternative Data to Assess Immediate Economic Impacts of Crises Conflict and Natural Disasters
This cutting-edge course is designed to equip students with the skills necessary to utilize alternative data sources for the immediate assessment of economic impacts caused by crises, such as conflicts and natural disasters.
View More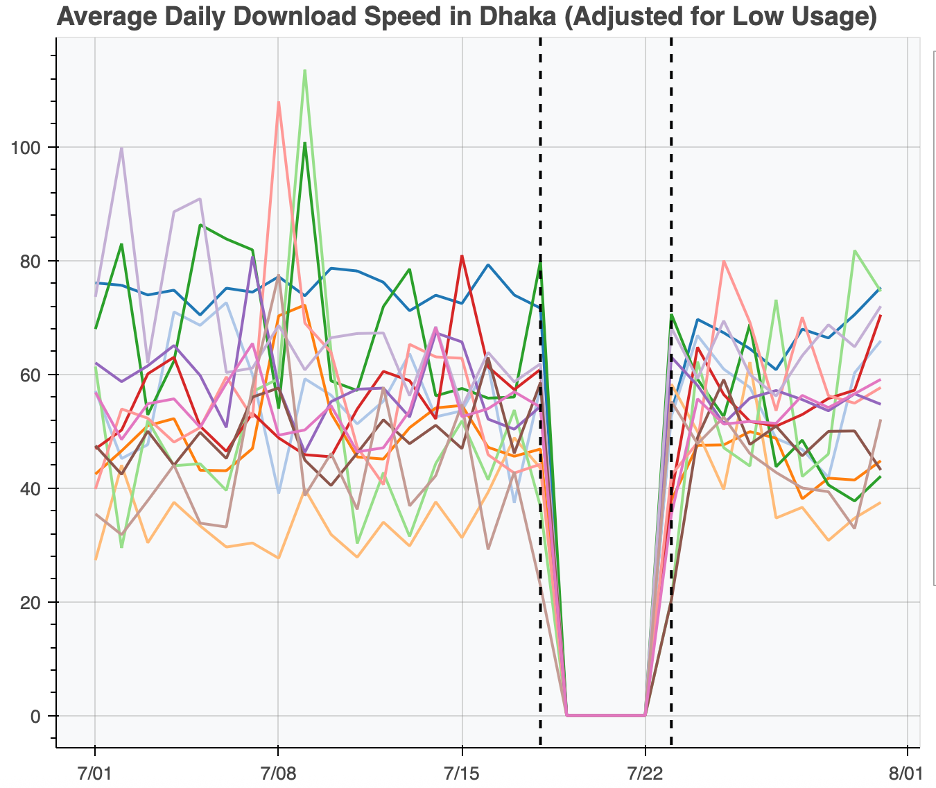
Bangladesh & South Asia Region | Economic Monitoring to Understand Poverty Trends
To understand the impacts of a coup in Bangladesh relative to the surrounding region, the team leveraged public and private sector data to analyze trends in employment, population movement, and others to fill information gaps.
View More